This webpage contains Supplementary material for the manuscript: Quantifying trade-offs in satellite hardware configurations via a super-resolution framework with realistic image degradation .
Satellite images
Satellite images in the different pages below show the variability of super-resolved image reconstructions, given different satellite hardware configurations.
For each terrain type, the following pages show zoomed images that highlight the variability of super-resolution image reconstruction quality under several different degradation values:
Supplementary figures
The below supplementary figures show SSIM values for different SNR50, GSD, and GRD values, averaged across all geographical types and crops, comparing the EDSR model trained on DIV2K data (Figure S1) and the TransENet model trained on remote sensing data (Figure S2).
Note that the two scaling factors we implemented across both models were x3 (GSD=1.8) and x4 (GSD=2.4), and in those rows the associated SSIM values are almost identical for both models. This suggests that there is little difference between each model’s ability to super-resolve the satellite imagery used in our study.
Fig S1: EDSR results
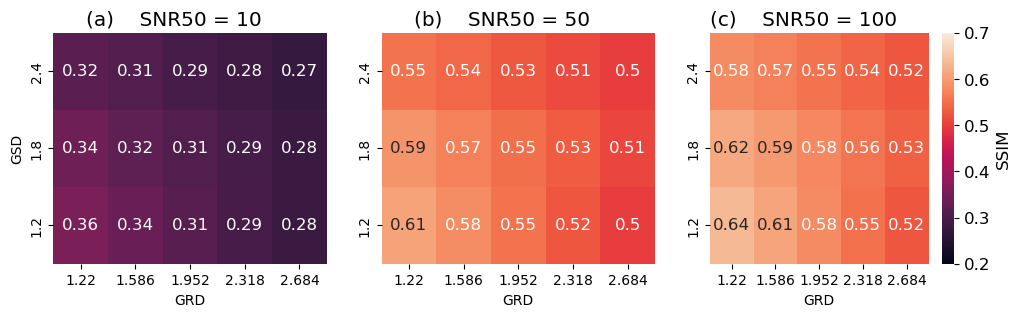 Figure S1: SSIM values for different SNR50, GSD, and GRD values, for the EDSR model (trained on DIV2K data). This figure is identical to Figure 6 from the paper.
Fig S2: TransENet results
![]() Figure S2: SSIM values for different SNR50, GSD, and GRD values, for the TransENet model (trained on remote sensing data).
Figure S2: SSIM values for different SNR50, GSD, and GRD values, for the TransENet model (trained on remote sensing data).